Fixed-income investors face a challenging environment. Traditional bonds struggle to keep pace with inflation. Meanwhile, residential solar panels can quietly deliver double-digit returns for homeowners who view them through an investment lens.
A solar installation with a six-year payback period generates returns comparable to high-yield corporate bonds.
Better yet, these returns come with unique tax advantages and inflation protection. For investors seeking fixed-income, solar deserves serious consideration as part of a diversified portfolio.
This analysis examines solar panels purely as a financial investment, assuming you purchase the system outright with cash. Just as you might allocate $30,000 to bonds or other fixed-income securities, you can deploy that same capital into solar panels. We’ll explore how to estimate returns, understand the unique benefits, and evaluate whether solar panels make sense for your investment strategy.
Understanding solar payback period
Homeowners often think about solar panels as a way to reduce electricity bills. Smart investors recognize something more valuable:
solar panels represent a fixed-income investment that generates tax-free returns through avoided electricity costs.
The payback period tells you how long your solar panels take to generate savings equal to your initial investment. For example, a five-year payback means your cumulative electricity savings equal your upfront cost after five years. Every year after that generates pure returns.
Think of it this way. You purchase an asset that produces a specific amount of value each year. The value comes from electricity you don’t have to buy from the utility company. Unlike a bond that pays interest, solar panels pay you through cost avoidance. The economics work the same way.
Your actual payback period depends on multiple factors:
- Solar irradiance in your location – How much sun your panels receive annually
- Current electricity rates – Higher rates mean faster payback
- System efficiency – Quality of panels and inverters affects production
- Available incentives – Federal, state, and utility rebates reduce effective cost
- Net metering policies – Whether you receive full credit for excess production
Residential systems today commonly achieve payback periods between four and eight years. The federal investment tax credit currently reduces solar costs by 30% through 2025. State and local incentives vary widely. These incentives can shorten your payback period, improving your investment returns. Future policy changes could restore or enhance these benefits, though it’s much easier to base decisions on current programs.
How to estimate solar investment returns
Calculating solar panel ROI becomes straightforward when you focus on two key variables. First, determine your payback period. Second, estimate how long your system will operate. The relationship between these two numbers determines your annual return.
Quick payback calculation
The basic formula for estimating your solar payback period:
Payback Period = (Total System Cost – Incentives) ÷ Annual Electricity Savings
For example: A $30,000 system with a $9,000 tax credit saves $3,000 annually Payback = ($30,000 – $9,000) ÷ $3,000 = 7 years
For a more detailed calculation tailored to your specific situation, use
EnergySage’s solar calculator or
NREL’s PVWatts Calculator. These tools factor in local sun exposure, electricity rates, and current incentives.
Consider a solar system with a five-year payback period. If that system operates for 25 years, you receive 20 years of free electricity after recovering your initial investment. This scenario generates an annual return of 19.8%.
The complete returns matrix shows how different combinations perform:
| Annual return over system lifetime under ideal conditions |
|
10 Years |
15 Years |
20 Years |
25 Years |
30 Years |
35 Years |
40 Years |
| 5 year payback |
15.1% |
18.4% |
19.4% |
19.8% |
19.9% |
20.0% |
20.0% |
| 6 year payback |
10.6% |
14.5% |
15.8% |
16.3% |
16.5% |
16.6% |
16.6% |
| 7 year payback |
7.1% |
11.5% |
13.1% |
13.7% |
14.0% |
14.1% |
14.2% |
| 8 year payback |
4.3% |
9.1% |
10.9% |
11.7% |
12.1% |
12.3% |
12.4% |
| 9 year payback |
2.0% |
7.2% |
9.2% |
10.1% |
10.6% |
10.8% |
10.9% |
| 10 year payback |
0.0% |
5.6% |
7.8% |
8.8% |
9.3% |
9.6% |
9.8% |
| 12 year payback |
N/A |
2.9% |
5.5% |
6.7% |
7.3% |
7.7% |
7.9% |
| 15 year payback |
N/A |
0.0% |
2.9% |
4.4% |
5.2% |
5.7% |
6.0% |
Key insights from the returns data:
- Systems with 6-year paybacks achieve returns exceeding 15% with typical 25-year lifetimes
- Even conservative 8-year paybacks deliver 11.7% returns over 25 years
- Extended system life beyond 25 years marginally improves returns
- The steepest return improvements come from reducing payback from 10 to 6 years
Modern solar panels typically operate effectively for 25 to 30 years. According to
NREL research on degradation rates, quality panels degrade at only 0.5% annually. Many manufacturers guarantee 80% or better performance after 25 years. Some systems continue generating electricity for 40 years or more. Longer system life means higher returns for any given payback period.
This framework sidesteps complex calculations about system size, electricity usage patterns, and utility rate structures. You don’t need to predict future electricity prices or estimate your household consumption. The payback period captures all these variables in a single metric.
These returns vary significantly by geography, with certain markets offering particularly compelling economics.
Regional solar economics
Solar returns vary significantly by location, driven primarily by electricity rates and available incentives. Three markets stand out for exceptional solar economics.
 Bay Area / Northern California
:
Pacific Gas & Electric customers face some of the nation’s highest electricity rates at 45 cents per kWh as of 2024. With California’s abundant sunshine, Bay Area homeowners typically see
payback periods of 6-7 years, even under the new NEM 3.0 rules. The combination of high rates and strong solar resources creates compelling economics despite recent policy changes.
New York City Metro:
Con Edison territory residents pay 29 cents per kWh during winter peak months. Combined with New York’s generous NYSERDA incentives, NYC homeowners achieve payback periods around 6-8 years. The state’s strong net metering policy remains intact, unlike California’s recent changes.
Westchester County: Perhaps the best solar market in the nation,
Westchester combines Con Edison’s high rates with exceptional state incentives. Local solar advocates report typical payback periods of just 6 years. The county’s affluent demographics and environmental consciousness drive strong adoption rates.
Solar’s unique investment benefits
Solar investments offer characteristics rarely found in traditional fixed-income securities. These benefits make solar particularly attractive for certain investors and portfolio strategies.
Tax-advantaged returns
Solar returns come as reduced expenses rather than taxable income. You save money on electricity bills instead of receiving interest payments. The IRS doesn’t tax money you don’t spend. A 15% return from solar equals a much higher pre-tax return from bonds, depending on your tax bracket.
An investor in the 35% tax bracket would need a bond yielding 23% to match a 15% solar return after taxes. This tax efficiency becomes more valuable as your income rises. High earners with significant equity compensation benefit even more from these tax-free returns.
Inflation-neutral performance
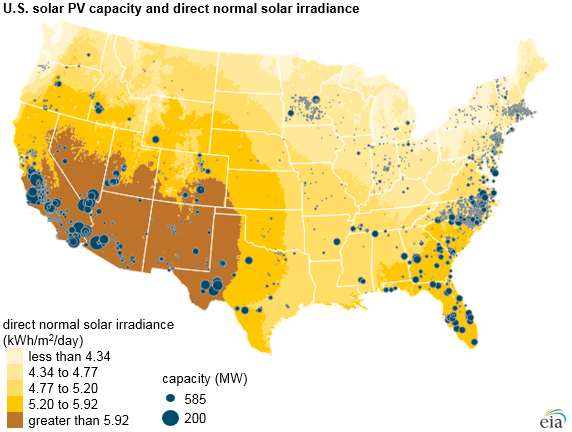
Electricity prices typically rise with or above general inflation.
The U.S. Energy Information Administration data shows residential electricity prices increased substantially over the past decade, often exceeding general inflation. When power costs increase, your solar savings grow proportionally. Your panels produce the same kilowatt-hours regardless of utility rates. Higher electricity prices mean each kilowatt-hour saves you more money.
Traditional bonds lose purchasing power during inflationary periods. Even Treasury Inflation-Protected Securities create tax complications. The inflation adjustment to TIPS principal generates taxable income each year, even though you don’t receive the cash until maturity. Solar investments potentially beat inflation when electricity prices rise faster than general price levels. This happened in many markets during 2022 and 2023 when energy costs spiked.
Avoiding traditional bond risks
Solar panels eliminate several risks inherent in bond investing:
No Duration Risk: Interest rate changes don’t affect your solar investment value. While bond prices fall when rates rise, your solar panels keep producing the same electricity savings. You won’t face mark-to-market losses if you need to value your portfolio.
No Reinvestment Risk: Bonds require reinvesting coupon payments at prevailing rates. When rates fall, reinvestment returns decline. Solar panels automatically “reinvest” by reducing your monthly bills at the same effective rate throughout their lifetime.
No Default Risk: Corporate and municipal bonds carry credit risk. Even highly-rated issuers occasionally default. Solar returns depend only on your panels producing electricity and you consuming power. There’s no counterparty risk.
No Downside Volatility: Your solar savings never decrease from month to month. While bond prices fluctuate daily, your panels steadily generate value. This stability reduces portfolio volatility and stress during market turbulence.
Uncorrelated returns
Solar panel performance doesn’t correlate with stock markets, bond yields, or economic cycles. Your panels generate electricity based on weather patterns and equipment reliability. Market volatility doesn’t affect your electricity production. Economic recessions don’t reduce sunshine.
This lack of correlation provides genuine portfolio diversification. During the 2020 market crash, solar panels kept generating returns. When bonds lost value in 2022’s rising rate environment, solar systems maintained their output. Adding uncorrelated assets improves portfolio risk-adjusted returns.
Important considerations and risk factors
Every investment carries risks. Solar panels present unique considerations that differ from traditional securities. Understanding these factors helps you make informed decisions.
Cash purchase assumption
This analysis assumes you purchase your solar system outright with cash.
Financing changes the economics significantly. Loan interest reduces returns significantly and leasing eliminates most investment benefits. Cash purchases maximize returns and maintain full control over the asset.
Think of this like choosing between buying bonds directly versus investing through a fund with high expense ratios. The cash purchase gives you the pure, unlevered returns. If you need to finance the purchase, solar likely won’t compete with traditional fixed-income investments.
Maintenance and repair costs
Solar systems require minimal but not zero maintenance. Based on industry data, expect these potential expenses:
- Inverter replacement: $2,000-4,000 after 10-15 years
- Annual cleaning: $150-300 in dusty environments
- Monitoring service: $100-200 annually (optional)
- Storm damage repairs: Varies, often covered by homeowner’s insurance
- Snow removal: DIY or $50-100 per occurrence
Most systems experience few problems during their lifetime. Annual maintenance costs average less than 1% of system value. Factor these expenses into your return calculations. Consider purchasing extended warranties or maintenance packages to reduce uncertainty.
Property tax implications
Some jurisdictions increase property tax assessments after solar installation. Your home value typically rises with the addition of solar panels which can mean higher property taxes. This ongoing cost reduces your net returns from solar savings.
Currently, over half of states offer property tax exemptions for solar additions. Research your local tax treatment before investing. Calculate the tax impact when determining your expected returns. In states without exemptions, the added tax typically reduces returns by 1-2 percentage points.
Technology and efficiency improvements
Solar technology continues advancing rapidly. Today’s panels produce more power per square foot than models from five years ago. Future panels will likely offer even better efficiency. Waiting might get you better technology at lower prices.
However, waiting also means missing current returns. Every year you delay costs you a year of savings. The opportunity cost often exceeds the benefit of slightly better future technology. Based on historical trends, panel efficiency improvements add roughly 0.5% annually while costs decline 3-5% per year. These improvements rarely justify waiting if you have a good payback period today.
Home sale complications
Solar panels affect home marketability.
Lawrence Berkeley National Laboratory research shows homes with owned solar systems sell for approximately $4 per watt of PV installed – about $15,000 for an average system. However, some buyers worry about maintenance or aesthetics. Leased systems create additional complexity with contract transfers.
Plan to stay in your home long enough to recoup most of your investment through electricity savings. If you might move within five years, solar becomes a speculative bet on home appreciation rather than a fixed-income investment.

How solar fits into your overall portfolio
Portfolio construction requires balancing risk, return, and correlation across assets. Solar panels occupy a unique position in this framework acting like alternative investments with fixed-income characteristics.
Critical limitation: Solar investments have a natural ceiling. Even offsetting 100% of your electricity usage typically costs only 3-5% of a million-dollar portfolio. A household consuming $400 monthly in electricity might need a $35,000 solar system.
Solar cannot replace your entire fixed-income allocation. Think of it as a high-returning satellite position rather than a core holding.
It is often recommended limiting alternatives to 10% to 20% of total portfolio value. Solar might represent half of this alternative allocation. For a household with a $1 million portfolio, a $50,000 to $100,000 solar investment fits these guidelines, though practical limits mean most installations fall below this range.
The investment works best for homeowners planning to stay put for 10+ years, with monthly electric bills exceeding $200, and who can make cash purchases. Solar particularly benefits investors in the 24% or higher tax brackets seeking inflation protection without TIPS complexity.
The investment poorly suits renters, those planning to move within 5 years, homes with poor sun exposure, or investors needing liquidity. Without cash for upfront purchase, the economics rarely compete with traditional investments.
Solar complements portfolios heavy in traditional stocks and bonds. The uncorrelated returns reduce overall portfolio volatility. The inflation protection hedges against rising prices. The tax efficiency improves after-tax returns. These benefits justify treating solar as a strategic asset allocation.
Case Studies: Enhancing REIT returns
Professional investors increasingly recognize solar’s investment merits.
Hannon Armstrong (NYSE: HASI), a publicly-traded REIT focused on sustainable infrastructure, generates consistent returns from solar investments. The company’s success demonstrates institutional confidence in solar economics.
Major REITs are installing solar on their properties, with Morgan Stanley estimating REITs control 38.5 billion square feet of solar-appropriate rooftops. Companies like Prologis and Brixmor Property Group use solar to reduce operating expenses and boost net operating income. When sophisticated real estate investors deploy capital into solar at scale, it validates the asset class for individual investors.
Solar investment risk and return profile
Solar investments offer a unique risk-return profile that differs fundamentally from traditional securities. Understanding these characteristics helps investors properly position solar within their portfolios.
Consider this comprehensive comparison across asset classes:
| Investment Characteristic |
Solar Panels |
Corporate Bonds |
Treasury Bonds |
Municipal Bonds |
Equities |
| Typical Returns |
10-20% |
5-9% |
3-5% |
3-4% |
8-12% |
| Income Type |
Cost avoidance |
Interest |
Interest |
Interest |
Dividends/gains |
| Taxation of Returns |
Tax-free |
Taxable |
Taxable |
Tax-free |
Mostly taxable |
| Inflation Protection |
Yes (automatic) |
No |
TIPS only* |
No |
Partial |
| Bond Risks |
No |
Yes |
Yes |
Yes |
N/A |
| Market Volatility |
None |
Moderate |
Moderate |
Low |
High |
| Liquidity |
Very low |
High |
Very high |
High |
Very high |
| Correlation to Markets |
Zero |
Moderate |
Low |
Low |
Full |
| Physical Maintainable Asset |
Yes |
No |
No |
No |
No |
*TIPS inflation adjustments create taxable phantom income annually
The comparison reveals solar’s distinctive advantage. While offering returns comparable to high-yield bonds, solar eliminates multiple risks inherent in traditional fixed-income investing. The trade-off comes in liquidity and the physical nature of the investment. Once installed, your investment cannot be easily converted to cash.
Common solar investment misconceptions
Several myths prevent investors from properly evaluating solar as an asset class.
“You need to offset 100% of your energy usage”: The investment returns remain the same whether you offset 40% or 100% of your consumption. A smaller $15,000 system with a 6-year payback delivers the same 16% annual returns as a larger $30,000 system with identical payback period. Size your investment based on available capital and roof space, not arbitrary coverage targets.
“Solar only works in sunny states”: Even cloudy Seattle generates positive returns. Germany, with less sun than most U.S. states, leads the world in solar adoption. The key factor isn’t sunshine but the relationship between electricity costs and system prices.
“Panels degrade quickly”:
NREL’s extensive degradation studies show modern panels lose only 0.5% efficiency annually. After 25 years, quality panels still produce 87% of original capacity. Some 40-year-old systems continue generating meaningful power.
“Technology changes make waiting smart”: While panels improve incrementally, waiting costs you current savings. Missing a year of 15% returns to potentially save 5% on equipment rarely makes financial sense.
Making the solar investment decision
Evaluating solar as an investment requires shifting perspective. Stop thinking about panels as home improvement. Start viewing them as income-producing assets that happen to sit on your roof.
The returns compete favorably with many traditional investments. Double-digit yields exceed most fixed-income alternatives. Tax advantages enhance after-tax returns while inflation protection preserves purchasing power. Uncorrelated performance improves portfolio diversification.
Calculate your likely payback period based on local sun exposure, electricity rates, and available incentives. Use online tools like
NREL’s PVWatts Calculator for initial estimates. Get quotes from multiple installers to understand actual costs. Compare your expected returns to alternative investments.
Remember that solar represents a long-term commitment. You’re essentially purchasing a 25-year inflation-protected bond with tax-free yields around 15%. Few traditional investments offer this combination of benefits. The investment suits those who value these characteristics over liquidity.
Ready to explore whether solar investing aligns with your financial strategy? Start here with our 4-question assessment to see if we’re a good fit to help optimize your investment portfolio.